Reference Guide: Optimizing Backup Strategies for Red Hat OpenShift Virtualization

Managing Kubernetes clusters requires more than just a basic understanding of its components and principles. Experienced systems administrators understand that basic setups can easily accommodate quick proofs of concept, but production-ready, highly available, resilient systems require leveraging additional tools and architectural considerations to cater to the advanced requirements of hosted applications. 

Thanks to its strong community, the Kubernetes ecosystem provides many options to address the challenges administrators typically face. That certainly is an advantage of Kubernetes, but it can also become a concern because choosing the right tool can become increasingly tricky. 

In this article, we discuss different aspects of Kubernetes management and describe tools that serve as industry leaders and solutions recommended through the CNCF landscape.

Summary of key aspects of Kubernetes management tools

Each aspect below represents both a technical domain where tool selection matters and an architectural decision point that shapes your cluster management strategy. Before choosing a tool, consider how these components interact within the broader technology landscape while supporting unique workload requirements.

Key aspect

Recommendation

Core Kubernetes management 

Implement a tiered management approach with critical lifecycle functions in external management planes for resilience while deploying performance-sensitive operations in-cluster under centralized coordination.

Configuration management and infrastructure as code

Progress from simple configuration overlays to templating and reusable infrastructure modules as organizational complexity grows.

CI/CD and GitOps 

When selecting your GitOps implementation, consider whether your priority is visual oversight and simplified management or deep Kubernetes integration with granular compliance controls.

Monitoring and logging

Implement observability beyond the native limits of Kubernetes with declarative monitoring and persistent logging for effective troubleshooting. 

Security and compliance

Strengthen Kubernetes security by combining native controls with specialized tools that integrate security metrics into your existing observability pipeline.

Backup and disaster recovery 

Implement a comprehensive backup strategy with cross-cluster recovery capabilities to support disaster recovery and multi-cloud deployments. 

Core Kubernetes management tools

Those familiar with Unix know that the environment can create focused components that do one thing well and then let users combine them into complete solutions. Along similar lines, the Kubernetes control plane deliberately focuses on core orchestration but avoids prescribing how you should manage your clusters at scale.

The limitations grow proportionally as your Kubernetes footprint grows. For instance, the kubectl command-line interface offers powerful control, but the local context model is hardly useful when managing dozens of clusters. Similarly, Kubeadm helps simplify cluster bootstrapping but leaves day-2 operations like upgrades, backup, and scaling as exercises for the operator. 

These growing pains inevitably lead organizations to consider specialized architectural decisions, with long-term operational implications:

  • Should you deploy management tools inside the clusters they manage or maintain separate control planes? 
  • Should you centralize access through a single pane of glass or distribute management capabilities closer to individual teams? 

Tiered architecture over in-cluster/external management 

In-cluster deployments like Kubernetes Dashboard provide simplicity, as they’re deployed as standard workloads using familiar patterns. At the same time, this approach creates a recursive dependency where your management tools depend on the very infrastructure they’re designed to manage. When a cluster experiences issues, your ability to diagnose and resolve problems may disappear precisely when it is needed most.

External management planes can potentially solve this recursive dependency but can introduce synchronization challenges. There are non-native tools like Rancher or Lens that maintain their own states about your clusters, essentially creating potential discrepancies between what the tool displays and actual cluster state. 

Most organizations with advanced setups eventually implement tiered approaches, such as a centralized management setup for core infrastructure concerns (like security and compliance) along with delegated capabilities for day-2 operations. As your ecosystem matures further, the tiered approach will typically evolve into a platform-as-a-product model that can easily scale beyond initial Kubernetes deployments. 

When selecting cluster management tools to support this tiered approach, the key consideration is resilience during failure scenarios. Critical cluster lifecycle functions like provisioning, upgrades, backup/restore, and disaster recovery should reside in external management planes that remain operational even when target clusters fail. Multi-cluster control planes like Rancher, VMware Tanzu Mission Control, or cloud provider consoles (EKS, AKS, GKE), and Red Hat Advanced Cluster Management (ACM) provide this separation. Specifically for Red Hat environments, ACM acts as the central “fleet manager” and, through the application of policies, can even orchestrate comprehensive backup strategies utilizing solutions like Trilio. For runtime operations requiring low-latency cluster access—such as log collection, metrics gathering, and service mesh functionality—in-cluster deployment provides optimal performance while still being coordinated through the external management layer.

Automated Kubernetes Data Protection & Intelligent Recovery

Perform secure application-centric backups of containers, VMs, helm & operators

Use pre-staged snapshots to instantly test, transform, and restore during recovery

Scale with fully automated policy-driven backup-and-restore workflows

Configuration management and infrastructure as code

When running a single Kubernetes cluster for development, manually writing YAML manifests can quickly become limiting. Kubernetes also offers limited built-in solutions for managing configurations across clusters or environments. 

If you are a heavy kubectl user, note that it operates only on a single cluster at a time, and while it can apply configurations from files, it provides no mechanisms for templating, environment-specific values, or managing dependencies between resources. 

There are various configuration management tools that address different aspects of this challenge. 

Maintaining configuration consistency across environments

It is recommended that you start with a base configuration for your application and create overlays for each environment that patch only the differing values. Kustomize offers the simplest adoption path with minimal overhead: Its base-and-overlay approach allows you to maintain a single source of truth while accommodating environment-specific variations without complex templating. The approach works well for organizations that prefer a pure YAML approach without the abstraction of a templating language.

Consider the following example directory structure that contains all shared settings of an application named darwin-app. Each environment overlay can be used to specify what differs in that environment. For example, a production overlay might increase the replica count, adjust resource limits, and enable specific security settings.

				
					darwin-app/
├── base/                   # Base configuration shared across all environments
│   ├── deployment.yaml     # Core deployment definition
│   ├── service.yaml        # Service definition
│   └── kustomization.yaml  # Lists resources in the base
└── overlays/
    ├── development/
    │   ├── kustomization.yaml  # References base and lists patches
    │   └── replicas-patch.yaml # Sets replicas to 1 for development
    ├── staging/
    │   ├── kustomization.yaml
    │   ├── replicas-patch.yaml # Sets replicas to 2 for staging
    │   └── memory-patch.yaml   # Increases memory for staging
    └── production/
        ├── kustomization.yaml
        ├── replicas-patch.yaml # Sets replicas to 5 for production
        └── memory-patch.yaml   # Highest memory allocation for production


Codifying infrastructure standards

As organizations mature, Helm becomes a good choice due to providing better encapsulation and reusability. Your platform teams can create organization-specific chart libraries that encode best practices while application teams consume these charts with simplified value overrides. Unlike Kustomize’s patch-based approach, Helm uses Go templates to dynamically generate Kubernetes manifests based on input values.

For broader infrastructure needs, you can use your provider’s native infrastructure tools (like AWS CDK, Azure Bicep, or Google Cloud Deployment Manager) combined with Terraform for resources not covered already by those tools. This lets you leverage provider-specific capabilities while maintaining declarative syntax for defining cloud infrastructure with strong state management capabilities.

Terraform also provides the most consistent experience across providers with its extensive provider ecosystem. You can create modular Terraform configurations that encapsulate standard patterns like production-grade Kubernetes clusters or application namespaces with quotas that can be reused across teams. For example, a Terraform module that encapsulates your organization’s standards for Kubernetes namespaces would look like this:

				
					# modules/team-namespace/main.tf
resource "kubernetes_namespace" "team_namespace" {
  metadata {
    name = "${var.team_name}-${var.environment}"
    labels = {
      "environment" = var.environment
      "team" = var.team_name
      "cost-center" = var.cost_center
    }
  }
}

resource "kubernetes_resource_quota" "team_quota" {
  metadata {
    name = "resource-quota"
    namespace = kubernetes_namespace.team_namespace.metadata[0].name
  }

  spec {
    hard = {
      "requests.cpu" = var.environment == "production" ? "20" : "10"
      "requests.memory" = var.environment == "production" ? "40Gi" : "20Gi"
      "pods" = var.environment == "production" ? "50" : "25"
    }
  }
}

# Team members can then simply use:
module "team_darwin_prod" {
  source = "./modules/team-namespace"
  
  team_name = "darwin"
  environment = "production"
  cost_center = "research-1234"
}


Watch this 1-min video to see how easily you can recover K8s, VMs, and containers

CI/CD and GitOps 

Unlike traditional configuration management tools that focus on imperative server configuration, Kubernetes fundamentally relies on a declarative approach: You specify the desired end state rather than the steps to achieve it. At the foundation level, this approach aligns perfectly with Git-based workflows, where changes are proposed, reviewed, approved, and then automatically applied rather than being manually executed.

The following example illustrates what this means in practice. 

Before GitOps (manual deployment):

				
					# Developer manually runs commands with potential for error
kubectl create deployment nginx --image=nginx:1.14.2
kubectl expose deployment nginx --port=80


In the above traditional approach, a developer directly uses kubectl commands to create a deployment (running an Nginx web server) and expose it as a service. This is an imperative approach, where each command directly tells Kubernetes what to do, and is prone to human error, inconsistencies, and lacks version control.

With GitOps (declarative deployment):

				
					# Developer commits YAML to git repository
---
apiVersion: apps/v1
kind: Deployment
metadata:
  name: nginx
spec:
  replicas: 1
  selector:
    matchLabels:
      app: nginx
  template:
    metadata:
      labels:
        app: nginx
    spec:
      containers:
      - name: nginx
        image: nginx:1.14.2
        ports:
        - containerPort: 80
---
apiVersion: v1
kind: Service
metadata:
  name: nginx
spec:
  ports:
  - port: 80
    protocol: TCP
  selector:
    app: nginx


Learn about the features that power Trilio’s intelligent backup and restore

Here, the developer defines the desired state of the Nginx deployment and service in YAML files. These files are then committed to a Git repository. A GitOps operator (like Argo CD or Flux) continuously monitors the repository and automatically applies the changes to the Kubernetes cluster. 

It’s important to note that the GitOps approach isn’t limited to application deployments. The declarative principles can also be applied to manage the entire Kubernetes cluster configuration, including namespaces, network policies, RBAC roles, and more. In a disaster recovery scenario, this allows for the automated re-creation of entire cluster configurations from Git. A typical recovery workflow could involve automatically provisioning new clusters, followed by using GitOps tools like Argo CD or Flux to redeploy the entire cluster configuration and then stateless applications. Stateful applications can also be recovered using dedicated backup and recovery tools like Trilio.

Enterprise-scale deployment orchestration

Built-in Kubernetes task management capabilities like jobs and cron jobs offer basic scheduling but lack the orchestration sophistication needed for complex workflows. While suitable for simple use cases, they provide no visual pipeline representation, limited dependency management, and minimal reporting capabilities. 

When you outgrow native constructs, look for CI/CD tools that can help you implement processes that require approval gates, complex testing sequences, or deployment coordination across multiple services. With rising complexity, you would need formalized change control and coordinated releases that simple deployment pipelines cannot provide.

GitOps improves upon traditional CI/CD by using cluster agents that continuously pull the desired state from Git repositories rather than pipelines pushing changes to environments. The model provides several advantages:

  • Your repository always reflects what’s running (or should be running).
  • Clusters don’t expose credentials to external systems.
  • Agents automatically correct drift between the desired and actual state.

ArgoCD and Flux are two leading platforms in this space that take different approaches to implementing GitOps principles.

ArgoCD enforces the desired state through continuous reconciliation loops. Rather than maintaining separate manifests for each cluster or namespace, you can define templates through ApplicationSets that automatically generate appropriate configurations based on cluster, environment, or custom parameters. Its declarative promotion workflows allow you to automatically advance applications between environments based on customizable criteria and approval gates, a capability that native Kubernetes lacks without significant custom development. 

Flux embraces a fully Kubernetes-native control plane with multiple specialized controllers (source-controller, kustomize-controller, helm-controller, and notification-controller) that can be installed independently based on requirements. 

The idea behind this design principle is to eliminate separate management overhead, but with the subtle cost of fewer visual deployment insights than ArgoCD’s rich UI.

If you are already accustomed to Kubernetes internals, the Flux model can be very intuitive.

Monitoring and logging

You get only rudimentary observability capabilities with Kubernetes out of the box, leaving a need to bridge significant gaps in production environments. When troubleshooting issues, kubectl logs will only show the output from currently running containers. Once a pod restarts or is rescheduled, that valuable diagnostic information disappears forever. Similarly,  kubectl top shows just a momentary snapshot of resource usage without any historical data to help admins with trend analysis or let them plan capacity effectively. In addition, for application-specific metrics like request latency, error rates, or business KPIs, Kubernetes provides no native collection mechanism at all.

Major cloud providers now support Prometheus and Grafana through managed service offerings. The broader Prometheus ecosystem includes several integrated components that collectively help you build a strong monitoring foundation through its pull-based architecture and automatic service discovery. For deeper visibility, you can instrument your application code with Prometheus client libraries to expose key performance indicators via HTTP endpoints that Prometheus can scrape.

You can also create a tiered dashboard approach similar to the following by pairing Prometheus with Grafana

  • Build infrastructure dashboards showing cluster-wide resource utilization.
  • Develop service-specific dashboards for each application team.
  • Create executive dashboards that translate technical metrics into business outcomes.

Automating the deployment and maintenance of these tiered dashboards requires declarative configuration. Unfortunately, native Kubernetes mechanisms fall short when monitoring resources. To apply the same GitOps principles to your observability stack that you use for applications, implement the operator pattern to bring monitoring into your existing Kubernetes workflows. When a development team deploys a new service, the team can include the corresponding ServiceMonitor resource that defines exactly how their application should be monitored. The Prometheus operator automatically detects this resource and reconfigures Prometheus accordingly without requiring any manual intervention.

Adding logging to your observability strategy

While Prometheus excels at capturing numerical metrics, it’s not designed for handling logs. For complete observability, the Elastic Stack (formerly known as “ELK” for Elasticsearch, Logstash, and Kibana) adds up to your overall observability strategy and works best when:

  • You need to perform full-text search across application logs.
  • You want to analyze unstructured or semi-structured log data.
  • You require complex log parsing and transformation capabilities.
  • Your troubleshooting process involves correlating events across multiple systems.
  • You need to retain logs for extended periods for compliance or security analysis.

Also deploying Fluentd as a DaemonSet ensures that logs from every container on every node are captured, enriched with Kubernetes metadata, and forwarded to Elasticsearch. The metadata enrichment is particularly crucial as it transforms raw container logs into contextualized information that reveals which namespace, deployment, or service generated each log line.

However, it’s important to note that the logging landscape continues to change. For instance, starting with OpenShift Logging 5.6, Vector has replaced Fluentd as the default log collector. Vector (built in Rust) is used for being a high-performance, vendor-neutral observability data router that offers considerable advantages in terms of resource consumption and flexibility.

Although use cases may call for a mix of other tools, the most effective implementations integrate the tools focused on similar aspects of monitoring. For example, when an alert fires in Prometheus, include direct links to relevant Kibana dashboards showing logs from the affected services. This integration dramatically reduces mean time to resolution by providing both signals that something is wrong (metrics) and diagnostic information to understand why (logs).

Security and compliance

Kubernetes standard security primitives provide essential foundations for protecting your applications. Still, without additional guardrails, Kubernetes will readily deploy containers with critical CVEs, outdated libraries, or malicious packages. Perhaps the most challenging aspect is integrating security visibility with your overall observability strategy; native Kubernetes controls provide no standardized way to export security metrics into monitoring systems like Prometheus. 

Specialized security tools like Prisma Cloud, Red Hat Advanced Cluster Security (ACS), Falco (from Sysdig), and Snyk directly address Kubernetes security limitations by identifying vulnerabilities the platform misses and seamlessly exporting these critical metrics into your Prometheus and Grafana ecosystem for immediate remediation. When security data lives in the same observability pipeline as operational metrics, you gain powerful correlation capabilities. For example, you can immediately see if a performance degradation event coincides with suspicious container activity or a newly deployed version introduces both reliability issues and security vulnerabilities.

Snyk addresses the vulnerability detection gap by scanning images before deployment and monitoring deployed workloads for newly discovered vulnerabilities. Unlike manual kubectl commands, Snyk continuously tracks vulnerabilities across your entire application inventory, prioritizes them based on actual exploitability, and often provides automated fixes.

Prisma Cloud extends the Kubernetes security model with behavioral monitoring and runtime protection. While Kubernetes can enforce a container running as a non-root user, Prisma Cloud can detect when that container suddenly attempts to modify system files or establishes unexpected network connections (activities that might indicate a breach but would go unnoticed by native controls).

That said, be careful of overcomplicating your cluster’s security posture with redundant tools when investing in proper configuration of Kubernetes’ native controls would have helped. If it’s just about plugging the security gaps that native controls cannot provide, consider combining native Kubernetes security features with specialized tools. For example:

  1. Implement all appropriate native controls (e.g., RBAC, network policies, pod security contexts) as your security foundation.
  2. Deploy Snyk for vulnerability management and shift-left security testing.
  3. Add Prisma Cloud for runtime protection and compliance monitoring.
  4. Integrate all security metrics into your existing Prometheus/Grafana observability pipeline.

Backup and disaster recovery 

Thanks to the very resilient nature of Kubernetes architecture, it is a fair expectation that individual applications will recover from failures independently. However, entire cluster failures require separate strategies and their handling should be planned in advance. 

Manual backups in Kubernetes involve creating snapshots or exporting data from Kubernetes resources and storing them in a safe location. The native Kubernetes state is stored in etcd, but backing up etcd alone is insufficient for complete recovery. Your backup strategy must account for persistent volumes, configuration, and custom resources that define your applications. This process can be done using built-in Kubernetes commands and tools like kubectl or rsync and then stored on cloud storage services such as AWS S3. 

The benefit of manual backups is their availability and relatively low cost. No additional tools are required to create snapshots; if configured correctly, they can be stored reliably and cost-effectively for as long as needed. The significant disadvantage of manual backups is the overhead they generate and their relatively low scalability. 

Cross-cluster recovery and migration

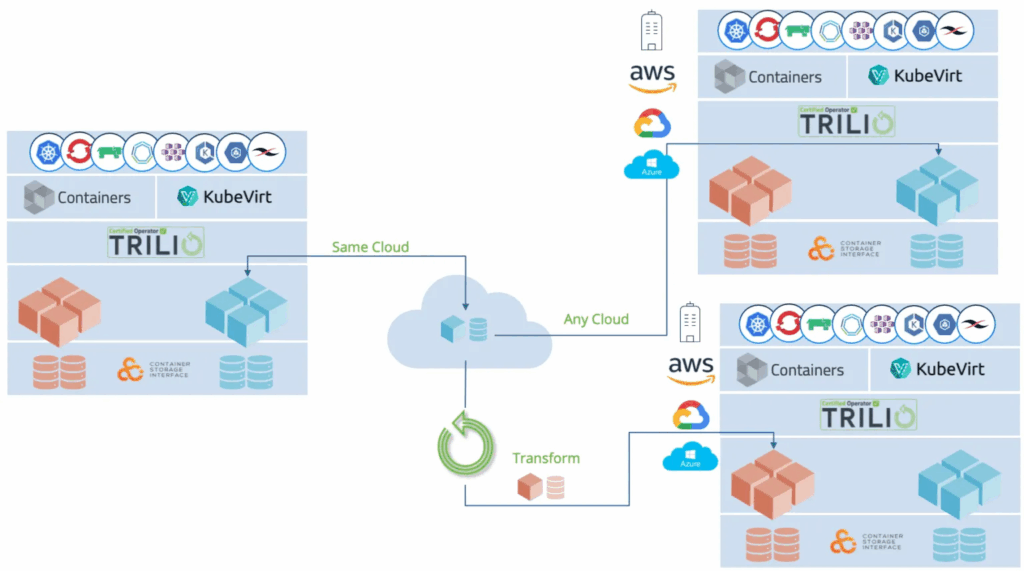
Platform engineering teams also need capabilities beyond simple disaster recovery within a single cluster. Cross-cluster recovery and migration capabilities enable organizations to move workloads between environments, whether it is for disaster recovery, cluster upgrades, or multi-cloud deployments. 

Advanced backup solutions such as Trilio facilitate this process by capturing the complete application state in a portable format that preserves relationships among Kubernetes resources. Trilio is an enterprise-grade backup and recovery solution designed specifically to operate at the Kubernetes API level. Its architecture uses operators to orchestrate CSI snapshots, manage backup retention, and ensure application consistency through pre/post-backup hooks. This provides a declarative backup model for platform engineers that integrates with existing GitOps workflows while maintaining the separation of concerns between infrastructure and application teams.

Comprehensive protection for Kubernetes operators with Trilio

Comprehensive protection for Kubernetes operators with Trilio

Trilio captures the entire state of Kubernetes applications, including configurations, metadata, persistent volumes, databases, and custom resources. Backups can be done incrementally, only reflecting any changes made since the previously generated backup. For mission-critical workloads, Trilio’s powerful recovery capabilities support cross-cluster migrations and point-in-time recovery, allowing you to achieve ambitious RTO/RPO targets without the complexity traditionally associated with enterprise backup solutions. 

Learn about a lead telecom firm solved K8s backup and recovery with Trilio

Last thoughts

Kubernetes dominates the container orchestration market, but its vanilla interface requires supplementary tooling to achieve operational efficiency at scale. There are many promising tools that deliver tangible benefits, but are you sure if they are right for your specific environment and use case? This guide cut through the hype to discuss various tools, and more importantly, the architectural decisions that should precede any tool selection. 

For comprehensive data protection that addresses the unique challenges of Kubernetes environments, book a demo to explore how Trilio’s cloud-native backup and recovery solution can safeguard your critical workloads.

Table Of Contents

Like This Article?

Subscribe to our LinkedIn Newsletter to receive more educational content

Privacy Overview

This website uses cookies so that we can provide you with the best user experience possible. Cookie information is stored in your browser and performs functions such as recognising you when you return to our website and helping our team to understand which sections of the website you find most interesting and useful.